Research
- Crime Categories
- Murder Circumstances
- Charges
- Murder Numbers by SHR
- Definitions of Murder
- Crime Literature
- Other Literature
- Seminars
- Journal Ranking
- Laws
- Changes in Law and Reporting in Michigan
- Citation Guides
- Datasets
Writing
Methods
- BLP
- Econometrics Models
- Econometrics Tests
- Econometrics Resources
- Event Study Plots
- Metrics Literature
- Machine Learning
Python-related
- Python Basic Commands
- Pandas Imports and Exports
- Pandas Basic Commands
- Plotting in Python
- Python web scraping sample page
- Two Sample t Test in Python
- Modeling in Python
R-related
- R Basics
- R Statistics Basics
- RStudio Basics
- R Graphics
- R Programming
- Accessing MySQL Databases from R
Latex-related
Stata-related
SQL
Github
Linux-related
Conda-related
AWS-related
Webscraping
Interview Prep
Other
Data Plot for the Variable of Percent Suicide by Gun
There is this concept of percent suicide by gun (PSG), which means the percent of suicides that are conducted by the gun. This measure is used as a proxy for gun ownership, because the more guns there are, the higher probability of using the gun to commit suicide. This data is obtained from the Center for Disease Control. Tracing the time trends for each state, we can see that for states that passed the law, the PSG measure of a large number of them increases, breaking the trend. The other states mostly see this measure decreasing over time.

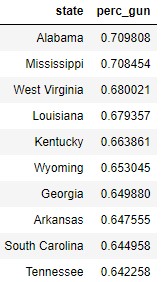
Out of all 50 states, the ones that average the highest percent suicide by gun between 2000 and 2014 are listed below. Out of the top ten, only one state does not have the syg law.

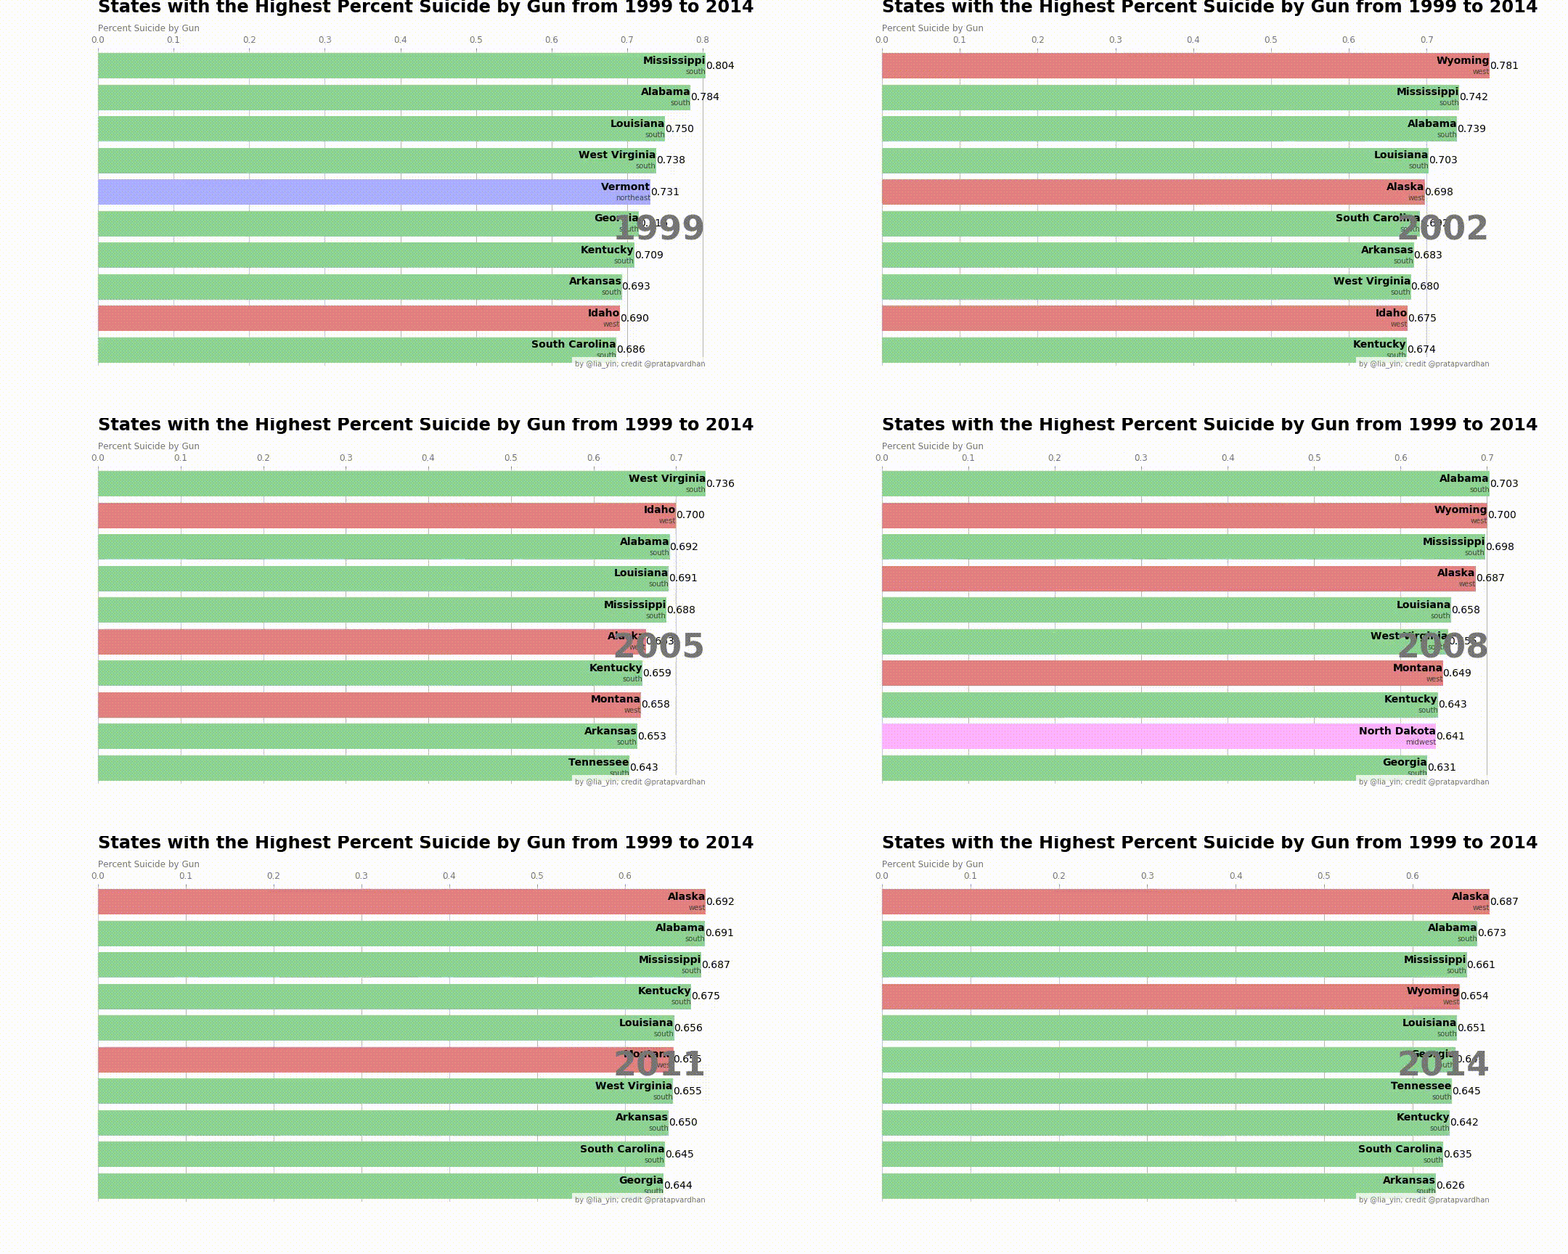
Here is a gif with data between 1999 and 2014. Note that most of the states in the top are southern states, with the color of green.
