Research
- Crime Categories
- Murder Circumstances
- Charges
- Murder Numbers by SHR
- Definitions of Murder
- Crime Literature
- Other Literature
- Seminars
- Journal Ranking
- Laws
- Changes in Law and Reporting in Michigan
- Citation Guides
- Datasets
Writing
Methods
- BLP
- Econometrics Models
- Econometrics Tests
- Econometrics Resources
- Event Study Plots
- Metrics Literature
- Machine Learning
Python-related
- Python Basic Commands
- Pandas Imports and Exports
- Pandas Basic Commands
- Plotting in Python
- Python web scraping sample page
- Two Sample t Test in Python
- Modeling in Python
R-related
- R Basics
- R Statistics Basics
- RStudio Basics
- R Graphics
- R Programming
- Accessing MySQL Databases from R
Latex-related
Stata-related
SQL
Github
Linux-related
Conda-related
AWS-related
Webscraping
Interview Prep
Other
Tables in LaTeX
This is the very first post of this blog, as LaTeX is very important to an academic, and tables are very important to an economist! The content go from the most basic tables to very complex ones. Let me know if there is anything else I should cover in this blog post!
Table of content
- Basic Tables
- Adding Notes
- Scaling tables
- Importing Tables from another File
- Multirow Table
- Multipage Table
- Tables in Appendix
Basic Tables
In order to create a table, the most common way is to use \begin{table}. And then \begin{tabular}{} where we can specify how many columns there are and what their alignments are. The common ones used are {l c c} if there are three columns or {l *{5}{c} m{4cm}} if there are seven. In order to add notes to the table, \multicolumn is helpful. Below is an example:
\begin{table}
\begin{tabular}{l *{5}{c} m{4cm}}
\hline
\textbf{Code} & \textbf{States} & \textbf{DtR} & \textbf{CD} & \textbf{Signed} & \textbf{Enacted} & \textbf{Law Stipulations} \\
\hline
03 & Arkansas & yes (wp) & yes (wp) & & no & \\
\hline
\multicolumn{7}{l}{\footnotesize DtR: Duty to Retreat} \\
\end{tabular}
\end{table}
The end result is displayed as below:

Adding Notes
If we want to add notes, we could use three part tables. In the header, we could add \usepackage{threeparttable}. In the body of the text, we could use
\begin{table}[H]
\caption{Comparing Weapon Percentage between First-Degree and Second-Degree Murder}
\label{tab:gun}
\centering
\begin{threeparttable}
	\begin{tabular}{*{3}{c}}
		\hline \hline
		First-Degree Murder & Second-Degree Murder & P-Value (One-Sided) \\
		\hline
		12.93\% & 15.28\% & .0269 \\
		\hline \hline
	\end{tabular}
\begin{tablenotes}[flushleft]
\small
\item	12.93\% of First-Degree Murder victims have a weapon compared to 15.28\% of Second-Degree Murder victims. If we hypothesize that the percentage for a Second-Degree Murder is higher, the p-value for the one-sided test comparing the two groups is .0269.
\end{tablenotes}
\end{threeparttable}
\end{table}
The resulting table would look like:

Note that we should always put \label after \caption because counter would only be reset by \refstepcounter after a call to \caption.
Alternatively, you could do:
Scaling tables
\begin{table}
\centering
\resizebox{\textwidth}{!}{
\begin{tabular}{r|lll}
 ...
\end{tabular}
}
\end{table}
Importing Tables from another File
With tables generated from software, we can use \input{D:/Research/Data/NCVS/perc_def.tex}. In order to add notes, we could use
\leftskip=2cm\rightskip=2cm, and for the rest of the article, we should add \leftskip=0cm\rightskip=0cm
Here is an example:
\input{D:/Research/Data/NCVS/perc_def.tex}
\vspace{1mm}
\leftskip=2cm\rightskip=2cm
In the category of something taken, only 3.3\% of crime cases face defense. For harassment/abusive language, 33.2\% of crime cases face defense.
\vspace{6mm}
\leftskip=0cm\rightskip=0cm
The resulting table would look like:

Click link for a good reference.
Click here if you would like table numbering to follow/unfollow the chapter headings.
Multirow Table
\usepackage{multirow}

\begin{table}[H]
	\centering
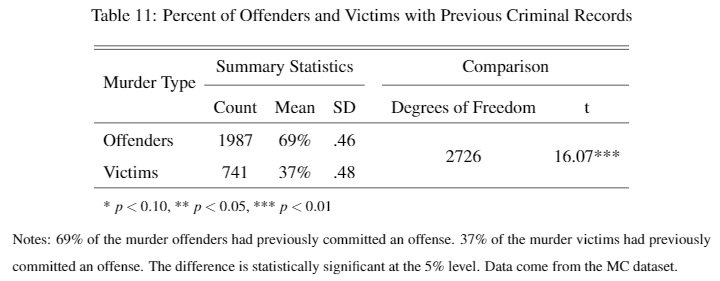
	\caption{Percent of Offenders and Victims with Previous Criminal Records}
	\label{tab: records_comp}
	\begin{tabular}{l *{6}{c}}
		\hline\hline
		\multirow{2}{*}{Murder Type} & \multicolumn{3}{c}{Summary Statistics}
		    & \phantom{}
		    & \multicolumn{2}{c}{Comparison} \\
		\cmidrule{2-4} \cmidrule{6-7}
		& Count & Mean & SD && Degrees of Freedom & t \\
		\hline
		Offenders & 1987 & 69\% & .46 && \multirow{2}{*}{2726} & \multirow{2}{*}{16.07***} \\
		Victims & 741 & 37\% & .48 & & \\
		\hline
		\multicolumn{6}{l}{\footnotesize * \(p<0.10\), ** \(p<0.05\), *** \(p<0.01\)}
	\end{tabular}
	\caption*{\footnotesize Notes: 69\% of the murder offenders had previously committed an offense. 37\% of the murder victims had previously committed an offense. The difference is statistically significant at the 5\% level. Data come from the MC dataset.}
\end{table}
Resulting table:

Multipage Table
\documentclass{article}
\usepackage{longtable}
\begin{document}

\begin{longtable}{ccc}
\caption{My caption for this table\label{foo}}\\\hline
Column 1 & Column 2 & Column 3\\\hline
\endfirsthead
\multicolumn{3}{@{}l}{\ldots continued}\\\hline
Column 1 & Column 2 & Column 3\\\hline
\endhead % all the lines above this will be repeated on every page
\hline
\multicolumn{3}{r@{}}{continued \ldots}\\
\endfoot
\hline
\endlastfoot
A & B & C\\     A & B & C\\
A & B & C\\     A & B & C\\
A & B & C\\ \newpage
A & B & C\\     A & B & C\\
A & B & C\\     A & B & C\\
\end{longtable}
\end{document}
Reference here, here, and here.