Research
- Crime Categories
- Murder Circumstances
- Charges
- Murder Numbers by SHR
- Definitions of Murder
- Crime Literature
- Other Literature
- Seminars
- Journal Ranking
- Laws
- Changes in Law and Reporting in Michigan
- Citation Guides
- Datasets
Writing
Methods
- BLP
- Econometrics Models
- Econometrics Tests
- Econometrics Resources
- Event Study Plots
- Metrics Literature
- Machine Learning
Python-related
- Python Basic Commands
- Pandas Imports and Exports
- Pandas Basic Commands
- Plotting in Python
- Python web scraping sample page
- Two Sample t Test in Python
- Modeling in Python
R-related
- R Basics
- R Statistics Basics
- RStudio Basics
- R Graphics
- R Programming
- Accessing MySQL Databases from R
Latex-related
Stata-related
SQL
Github
Linux-related
Conda-related
AWS-related
Webscraping
Interview Prep
Other
Pandas Basic Commands
(Updated on 7-17-2023.)
This post serves as a cheat sheet for the basic commands in Pandas.
Table of Contents
Dataframe Commands
Make new dataframe where the lists in the np.array function are rows (reference):
df2 = pd.DataFrame(np.array([[1, 2, 3], [4, 5, 6], [7, 8, 9]]),
                   columns=['a', 'b', 'c'])
Make new dataframe from multiple lists, each of which will be a column in the dataframe:
d = {'col1': [1,2], 'col2': [3,4]}
df = pd.DataFrame(data=d)
Make a list of dataframes from names in a list:
i = 0
for df_name in list_dfs:
    globals()[df_name] = df.loc[df.id == 'id-0000' + str(i)]
    i += 1
Dataframe row and column count
df.shape
Get basic information about dataframe
df.info(verbose=True, show_counts=True)
Get summary statistics of the numeric variables
df.describe()
Check if there are missing values
df.isnull().values.any()
Check for duplicates
df.duplicated().values.any()
Drop duplicates
df.drop_duplicates()
Merge two dataframes by a certain column:
pd.merge(df1, df2, on='company')
Display a slice of the data:
all.head()
Display all unique values in dataframe (link):
column_values = df[["A", "B"]].values.ravel()
unique_values =  pd.unique(column_values)
Append dataframes:
df = pd.concat([df1, df2], ignore_index=True)
Save dataframe as LaTeX table (Reference):
df.to_latex('finxters.tex', index=False, caption='User Details')
Include hyperlinks into dataframes (Reference):
HTML(df_legislations.to_html(render_links=True, escape=False))
Make a dataframe that is identical to an existing dataframe (Reference):
deep = s.copy()
Display all rows or all columns(Reference):
pd.set_option('display.max_columns', None)
movies.head()
pd.set_option('display.max_columns', 20)
Row Tricks
df.dropna(subset=['name', 'toy'])
Find rows that contain certain values (Reference):
df[df.values == 'banana']
contain_values = df[df['month'].str.contains('Ju')]
Repeat rows multiple times:
df_law = df_law.loc[np.repeat(df_law.index.values, 15)].reset_index(drop=True)
Pandas forward fill:
df['x'] = df.groupby(['id'])['x'].ffill()
Column Tricks
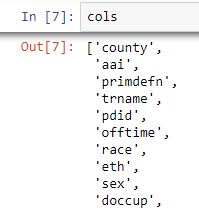
In order to see all the column names, we could do the trick below:
cols = y1988.columns.tolist()
cols
In Jupyter notebook, the following is displayed:

Find column index:
df.columns.get_loc("pear")
Rename column from “Unnamed: 0” to “State” for the dataframe called “all”:
all = all.rename(columns={"Unnamed: 0": "State"})
Concatenate columns:
shr['nameyear'] = shr['name'] + shr['year'].map(str)
Remove columns:
data = data.drop(["Y2001", "Y2002", "Y2003"], axis=1)
Remove all columns between column index 1 to 3:
df.drop(df.iloc[:, 1:3], inplace = True, axis = 1)
df = df[['mean', 4, 3, 2, 1]]
Remove column name, especially after crosstab:
df_murder_type.columns.name = None
Rounding a column:
df.round(1)
df.round({'dogs': 1, 'cats': 0})
Adding columns
Insert column with incremental year
ar_year = df_law.groupby('State.1').cumcount()+2000
df_law.insert(1, 'Year', ar_year)
Convert integer to datetime and add as column
df_law['Date'] = pd.to_datetime((df_law['Year']), format='%Y')
Add column based on conditions
df_law['Around Law Year'] = np.where(
    ((df_law['Law Passing Date'].dt.year - df_law['Year'])==1) | \
    ((df_law['Law Passing Date'].dt.year - df_law['Year'])==0) | \
    ((df_law['Law Passing Date'].dt.year - df_law['Year'])==-1), 1, 0)
conditions = [
    df_law['Year'] < df_law['Date.1'].dt.year,
    df_law['Year'] == df_law['Date.1'].dt.year,
    df_law['Year'] > df_law['Date.1'].dt.year
]
values = [
    0,
    (df_law['Date Next Year'] - df_law['Date.1']).dt.days/ \
    (df_law['Date Next Year'] - df_law['Date']).dt.days,
    1
]
df_law['Law'] = np.select(conditions, values)
Reshape data from wide to long:
all = pd.wide_to_long(all, stubnames="", i="State", j="Year")
Resetting index:
df = df.reset_index(drop=True)
Change multilevel index to single level:
all = all.reset_index()
Check data type:
all.dtypes
Check the shape of data, namely how many rows and how many columns they have:
all.shape
Change data type. Note that NaN can only be changed into float but not into integer.
all['ER Visits'] = all['ER Visits'].astype(float)
Sort values:
avg.sort_values("perc_gun", inplace = True, ascending=False)
Replace values:
all.replace(0, 5)
Drop values:
df = df[df.line_race != 0]
df = df['State'].str.strip(' ')
Change Column Data Type
Change to numeric:
# convert column "a" of a DataFrame
df["a"] = pd.to_numeric(df["a"])
Change from categorical to numeric:
list = ['charg5', 'charg4', 'charg3', 'charg2', 'charg1']
for charges in list:
    df_circum[charges] = df_circum[charges].cat.codes
Change to integer:
df[list("ABCD")] = df[list("ABCD")].astype(int)
Change from string to categorical
df['zipcode'] = df.zipcode.astype('category')
Data Tricks
Frequency table for a column:
df_circum['charg1'].value_counts()
Replace a number with NaN:
df_circum['charg1'] = df_circum['charg1'].replace(-1, np.NaN)
Replace a value based on a criterion:
df.loc[df['First Season'] > 1990, 'First Season'] = 1
Some Groupby Tricks
Add new column that increments on a number
ar_year = df_law.groupby('State.1').cumcount()+2000
df_law.insert(1, 'Year', ar_year)
Groupby single column in pandas (Reference)
df1.groupby(['State'])['Sales'].mean()
Group by and aggregate different columns based on different rules(Reference)
df.groupby('group').agg({'a':['sum', 'max'],
                         'b':'mean',
                         'c':'sum',
                         'd': lambda x: x.max() - x.min()})
Group by and counting the number of rows(Ref)
occur = data.groupby(['Section']).size()
Datetime
Series
df_law['Date.1'].dt.year